A clean chart is not the same as an honest chart
Most reporting mistakes are not errors in the data. They are errors in the visual layer between the data and the decision-maker. A chart can use accurate numbers, pull from a verified source, and refresh on schedule, and still mislead the person who needs to act on it. The bar chart with a truncated y-axis exaggerates a two-percent change into what looks like a doubling. The line chart with too many series becomes a tangled thread the eye cannot follow. The dashboard that packs twenty KPIs onto one screen buries the single metric that should drive the next meeting's agenda.
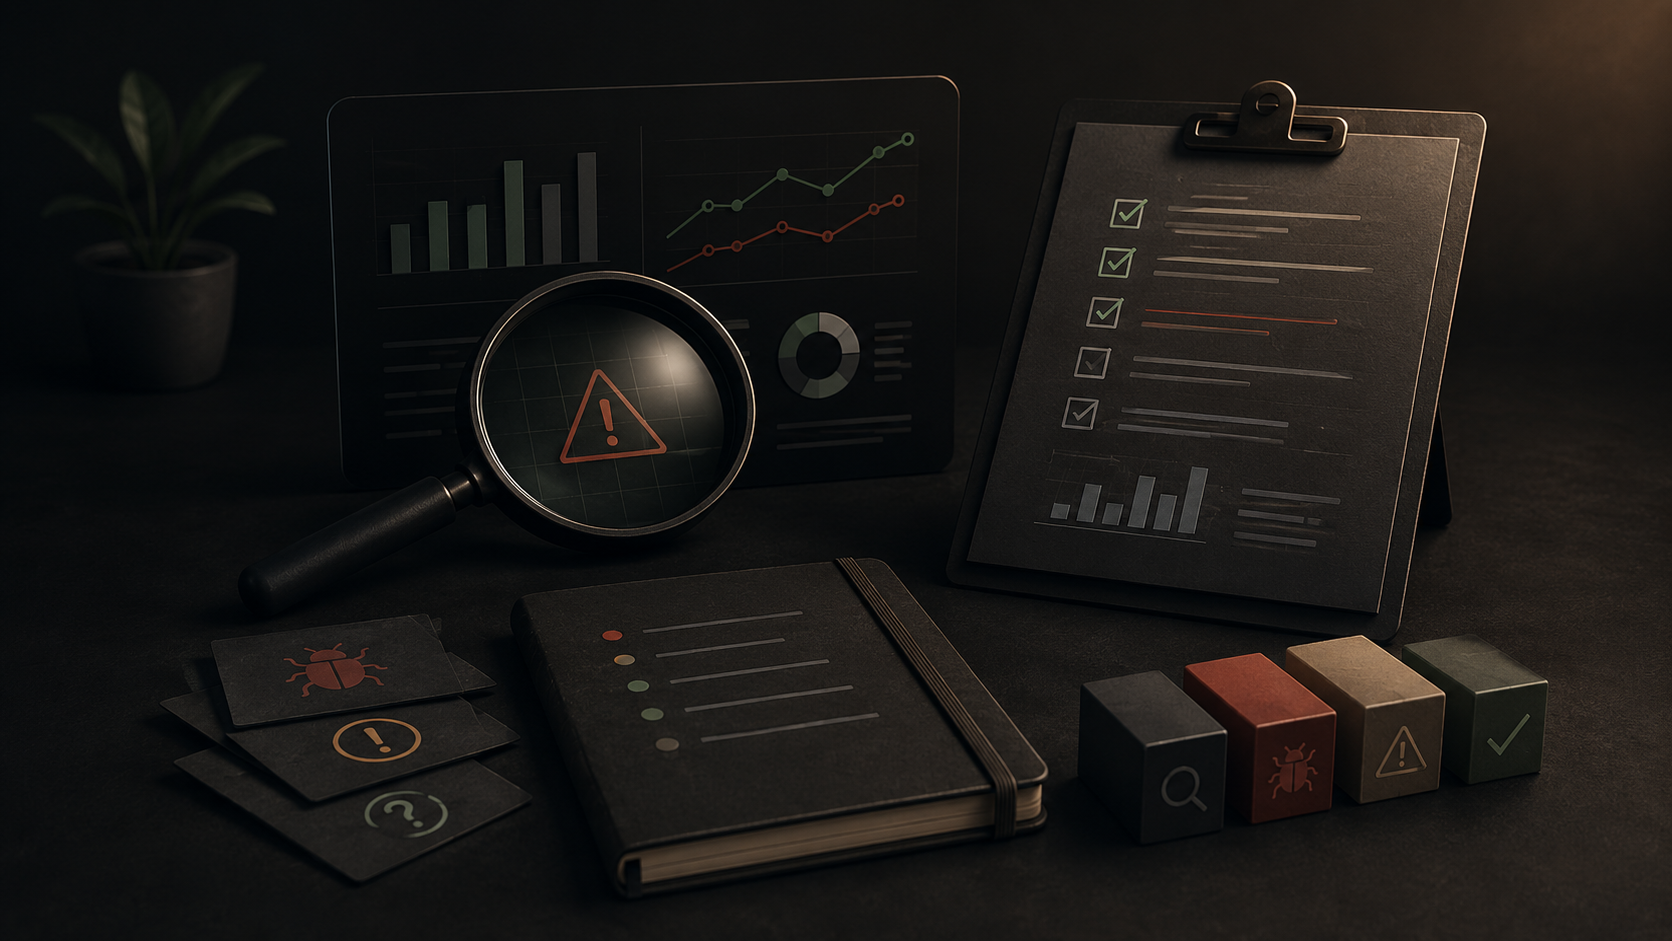
The Reporting Visualization Readiness Checklist exists because a chart that passes a visual scan has not passed a decision-readiness test. The checklist checks five things that most teams never check: whether the chart type matches the comparison job, whether the axis and scale make the magnitude honest, whether color directs attention to the signal or competes with it, whether the dashboard separates monitoring from decision evidence, and whether every visual conclusion carries a visible caveat, an owner, and an approval state. A Gartner study found that poor data interpretation costs organizations an average of twelve point nine million dollars annually, and ClicData's 2026 research on cognitive load confirms that dashboard clutter increases decision fatigue and misinterpretation risk. The checklist is not a design review. It is a truth check.
- Before approving any chart for a growth decision, state the exact comparison it is making. If you cannot name it in one sentence, the chart is not ready.
- Cognitive load is the hidden cost of a cluttered dashboard. Every extra visual element that does not support the decision is an element that makes the decision harder to reach.
Chart type is not a design choice. It is a comparison contract.
Every chart makes a promise. A bar chart promises to compare categories. A line chart promises to show movement over time. A scatter plot promises to reveal relationships between two variables. When the chart type breaks its promise, the viewer's brain works against the visual instead of with it. A bar chart showing a trend over twelve months forces the eye to compare bar heights when it should be tracking a slope. A pie chart with nine slices asks the viewer to compare angles that are nearly identical. The right chart type reduces the cognitive work of reading the data and lets the viewer spend their attention on what the data means.
Julius AI's 2026 visualization guide recommends starting every chart with the question it answers, not the data it contains. A chart that answers a ranking question should use bars. A chart that answers a movement question should use lines. A chart that answers a composition question should use stacked areas or a treemap, not a pie chart with too many slices. The comparison job dictates the chart type. If the chart type does not match the comparison job, replace the chart. No amount of formatting fixes a chart that promises the wrong thing.
- List the five most common comparison jobs: ranking categories, tracking movement over time, showing part-to-whole composition, revealing correlation between variables, and highlighting exceptions. Match each job to its correct chart type before opening the design tool.
- When a single chart tries to answer two comparison jobs at once, split it into two charts. A dual-axis chart that shows both trend and composition usually serves neither purpose well.
An axis is an argument. Check whether it argues honestly.
Axis manipulation is the most common way a chart lies without changing a single data point. A y-axis that starts at eighty percent instead of zero makes a three-percent decline look like a collapse. A time axis that skips quarters without labeling the gap creates a trend line that implies continuity where there is none. A sort order that ranks by alphabetical category name instead of metric value hides the top performer at the bottom of a long bar chart. These are not cosmetic issues. They change what the viewer believes the data says.
The checklist requires checking the baseline, interval, sorting, units, and labeling on every axis before the chart is shared. For bar charts, the y-axis baseline should be zero unless there is a specific, documented reason to truncate it and a visible broken-axis indicator. For line charts, the time interval should be continuous and labeled. Sorting should match the comparison job: descending for ranking, chronological for time series. If a reasonable person would interpret the chart differently after seeing the axis settings, the chart is not honest.
- Always label both axes with the metric name and unit. A chart with an unlabeled y-axis is asking the viewer to guess what they are looking at, and they will guess wrong at least some of the time.
- When truncating an axis is necessary to show meaningful variation in a narrow range, add a visible break indicator and document the caveat in the chart notes. Never truncate a bar chart axis without disclosure.
Color should direct attention, not compete for it
Color is the fastest path through a visualization and the easiest way to misdirect the viewer. A chart that uses a different color for every category asks the eye to process ten distinct values before it can find the pattern. A color scheme that uses red and green as the only encoding fails for approximately one in twelve viewers with color vision deficiency, per WCAG accessibility research. A chart that colors every bar equally bright blue tells the viewer that every category is equally important, even when one category is the exception the team needs to act on.
The checklist requires that color serve a specific job. Use color to highlight the decision signal: the category that is performing above target, the trend line that is diverging from forecast, the segment where the caveat applies. Use grayscale or muted tones for baseline categories. Limit the color palette to the number of distinct signals the viewer needs to process. If color is competing with the finding instead of pointing to it, the visual emphasis is wrong. ClicData's 2026 research on dashboard misreads found that when color draws attention to the wrong element, stakeholders spend meeting time debating chart design instead of discussing the decision.
- Test every chart in grayscale before publishing. If the key insight disappears when color is removed, the chart relies on color as a crutch rather than as an amplifier.
- Use a single accent color for the exception, the target, or the caveat. Everything else should recede. If every category is highlighted, nothing is.
A dashboard that shows everything supports no decision
The most common dashboard failure in 2026 is density without purpose. A single screen packed with twenty KPIs, three chart types, a table, and a real-time counter is not a dashboard. It is a wall of noise. The viewer cannot tell which metric changes require action and which are informational background. The monitoring metrics that a team checks daily are mixed with the decision metrics that a team uses once a quarter, and both get the same visual weight. The result is a screen that everyone glances at and nobody acts on.
The checklist requires separating monitoring context from decision evidence. Monitoring metrics belong on a monitoring dashboard, updated frequently and reviewed briefly. Decision evidence belongs in a focused memo or a decision-specific dashboard that answers one question with the minimum number of charts needed. If the dashboard forces the reviewer to scan for the insight instead of presenting it, the density is too high. Create a separate decision memo that extracts only the charts and caveats relevant to the approval question.
- Count the charts on any dashboard used for a growth approval. If the number exceeds five, identify which two or three directly support the decision and consider removing the rest from the approval view.
- Label every dashboard with its intended use: monitoring, diagnosis, or approval. A monitoring dashboard that is presented as approval evidence will create confusion about what the reviewer is supposed to decide.
Sample Review Note
The reviewer confirms that every chart type matches its comparison job. Bar charts compare categories. Line charts show movement over time. No chart is trying to do two jobs at once. Axes are labeled, baselines are zero or have a documented truncation reason with a visible break indicator, and sorting matches the comparison task. Color highlights the exception, the target, or the caveat. Baseline categories recede. The grayscale test confirms the insight survives without color. The dashboard separates monitoring context from decision evidence, and the approval view shows only the charts that support the recommendation.
If any chart is updated, any data source is refreshed, or any filter or segment is changed after this review, the affected visualization is gated for recheck. The recommendation stays held until the reviewer confirms that the visual change did not alter what the evidence appears to show. A chart that passes a readiness check stays ready only as long as the data and the design remain unchanged. The discipline is in the recheck.